Journals and logs
Journals
Error log
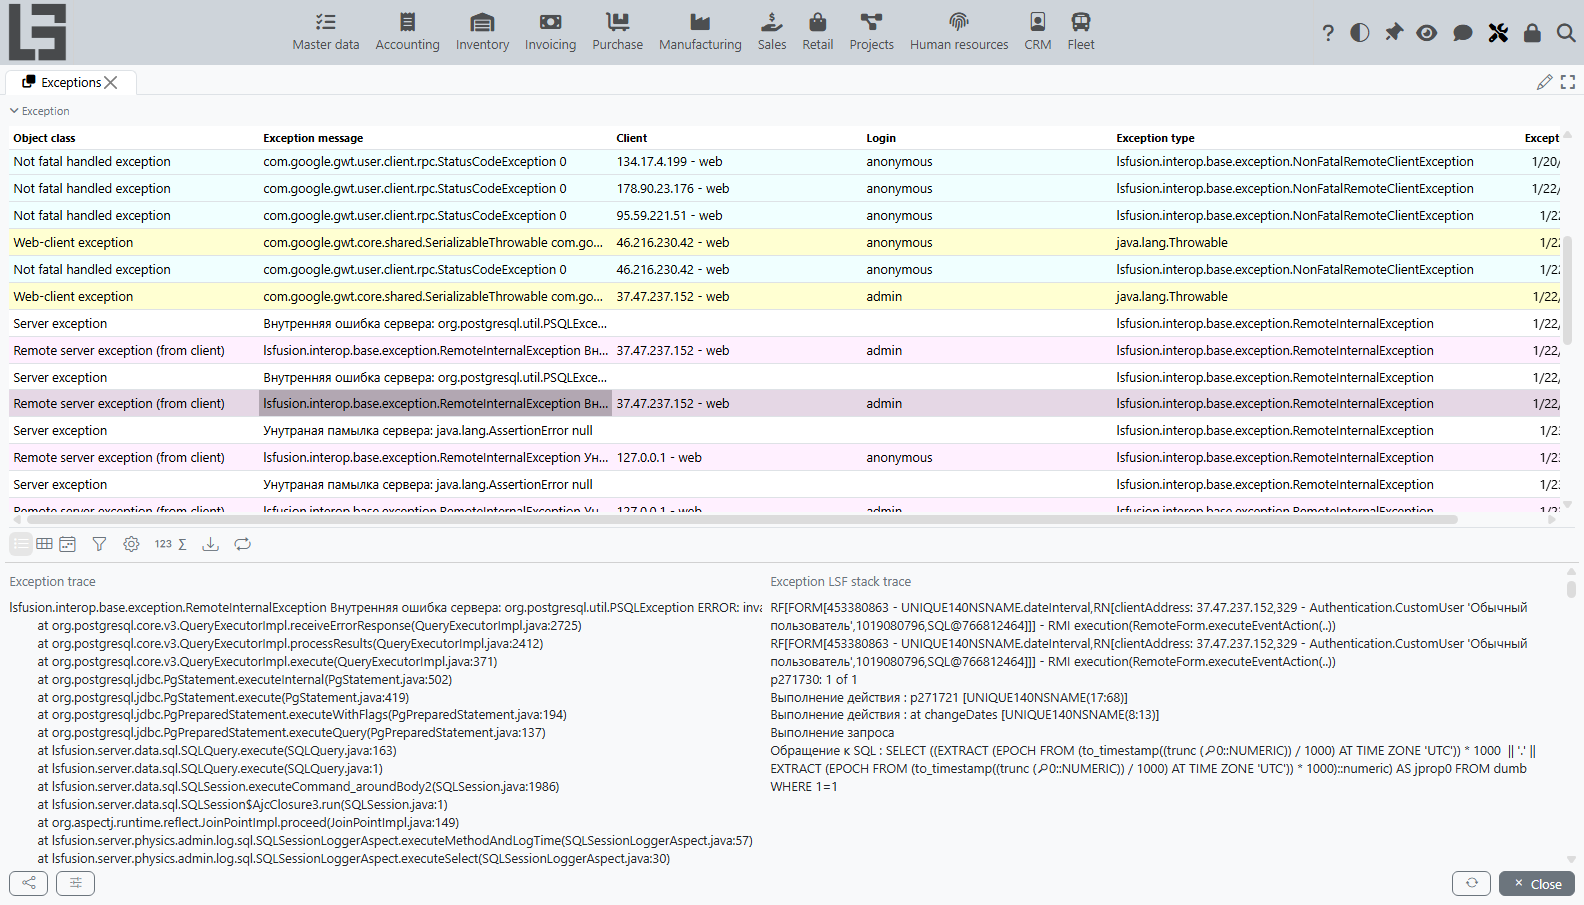
Contains all errors that occurred during the operation. Errors are divided into the following classes (the Object class column):
- errors that occurred on the server — displayed on a white background and included in the single class
Exception on server; - errors that occurred on the server and were received by the client application — displayed on a pink background and included in the single class
Exception on server (from client); - errors that occurred in the client application — displayed on a yellow background and fall into two classes:
Exception on clientandException on web client; - connection errors — displayed on a blue background and divided into two classes:
Temporary connection loss— connection with the server was interrupted, but was then restored;Permanent connection loss— connection with the server was interrupted and could not be restored.
The Exception trace section displays the java stack for the error; the Exception LSF trace displays the lsfusion stack; the Async exception trace section displays the stack of the asynchronous request that spawned the failing one (relevant for errors in background threads and event handlers, where the regular stack does not show the originating user context).
Connection log
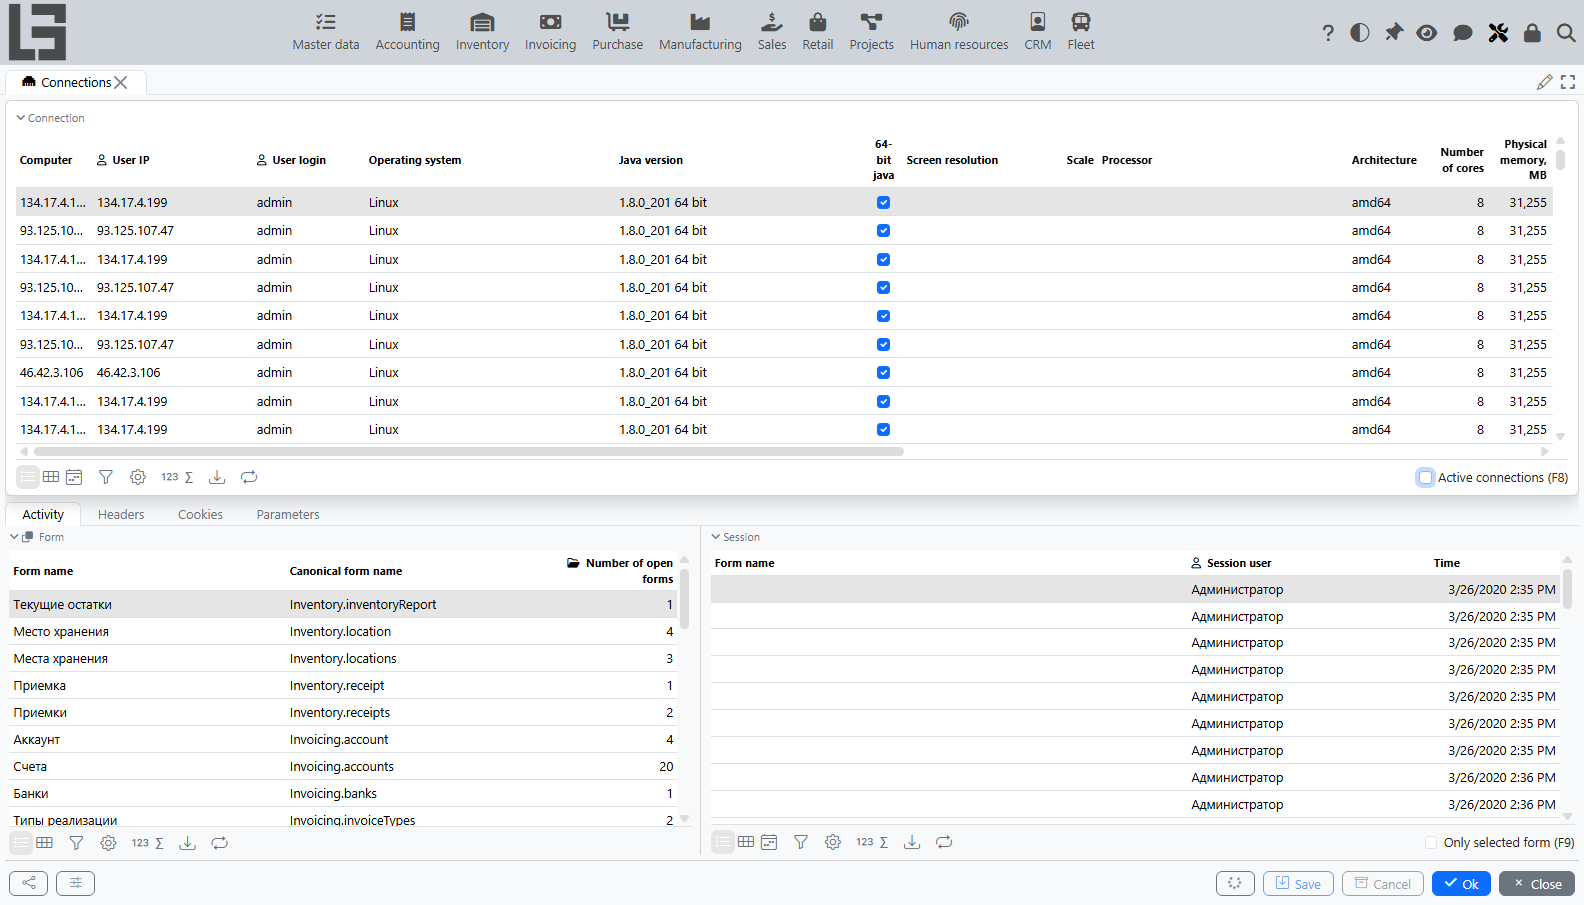
Stores information about users who connected to the system, from which computer, the characteristics of that computer, as well as information about the date and time of connection / disconnection. On the form, you can display the users currently working with the database — the Active connections checkbox.
The Form section shows which forms the user entered and how many times. The Session section lets you trace when changes were applied, for some forms.
Startup log
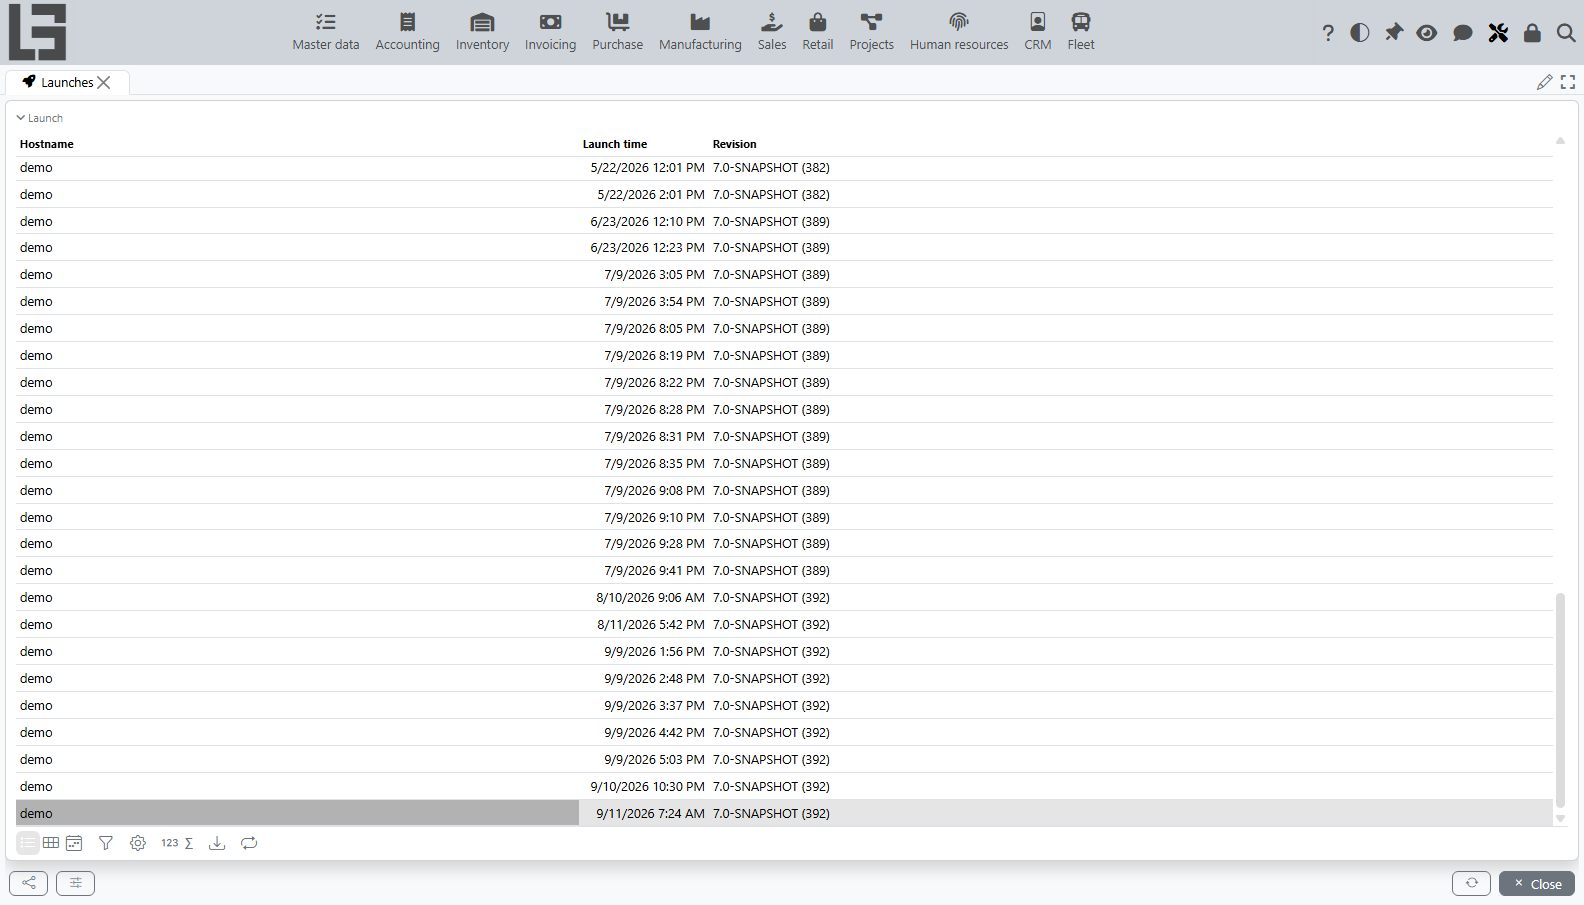
Stores information about the dates and times when the application server was started (restarted). You can also see the name of the computer on which the server is installed and the version of the application (if filled in during the build).
Change log
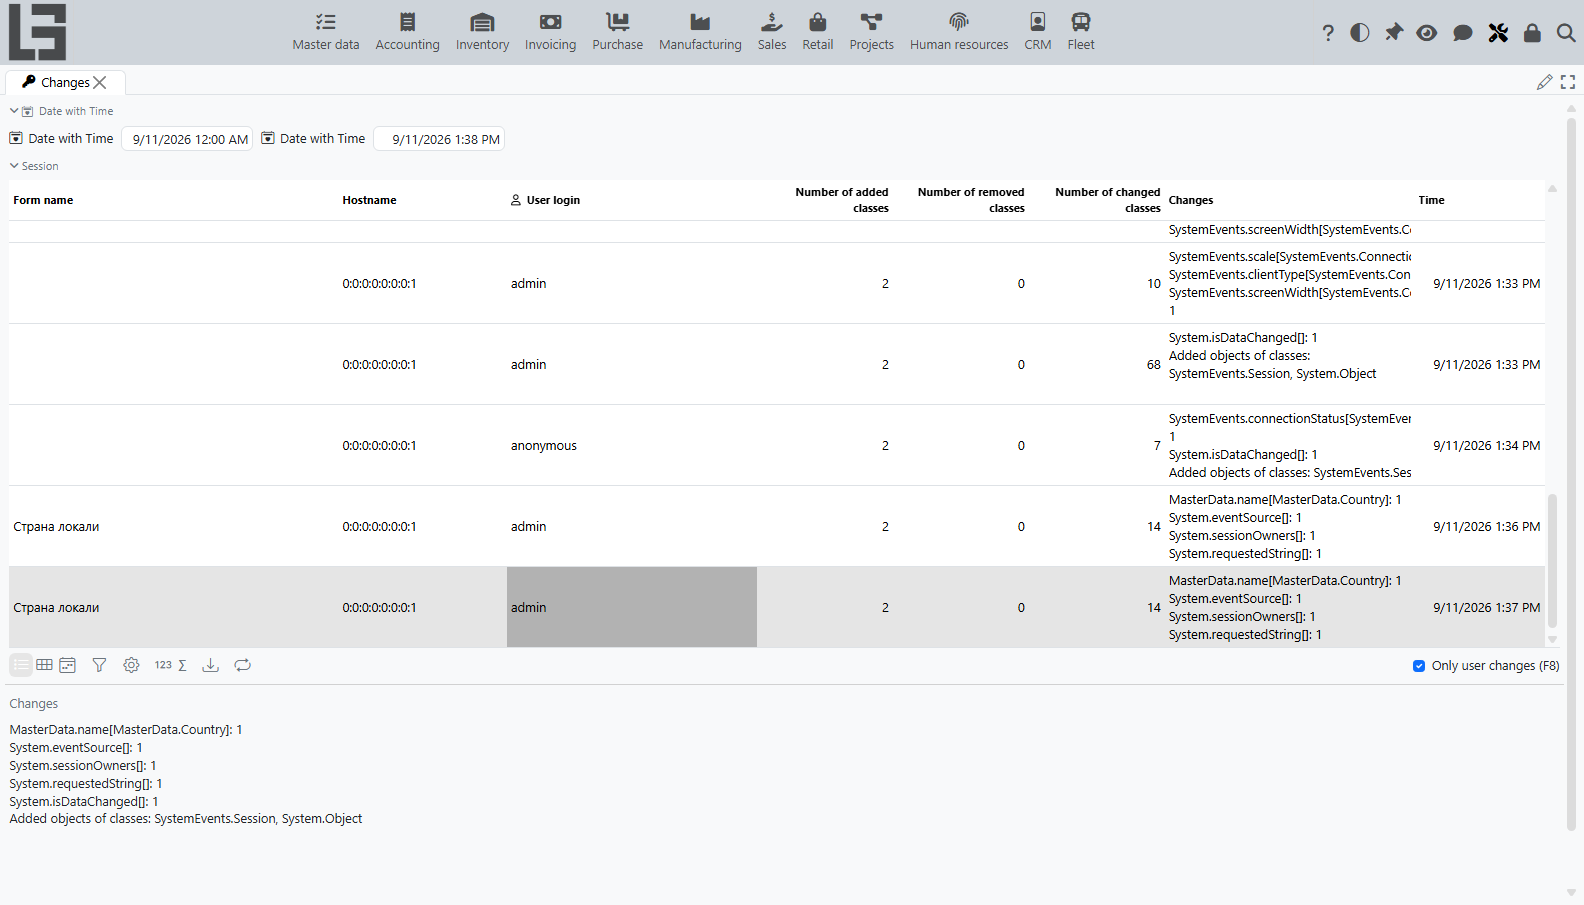
Contains more detailed information about the changes which were reflected in the Session section of the connection log. The Change column displays a list of Properties (columns) where the values changed, as well as the number of changes (rows). Only changes in the current form are logged: dependent Properties that change simultaneously on other tables do not feature on this list.
By default the list of changed properties is not logged — only the summary counts remain in the Change column. Full logging is enabled by the logChangesSession setting.
The form lets you filter the changes made by users (excluding system changes) by checking Only user changes.
Client application log
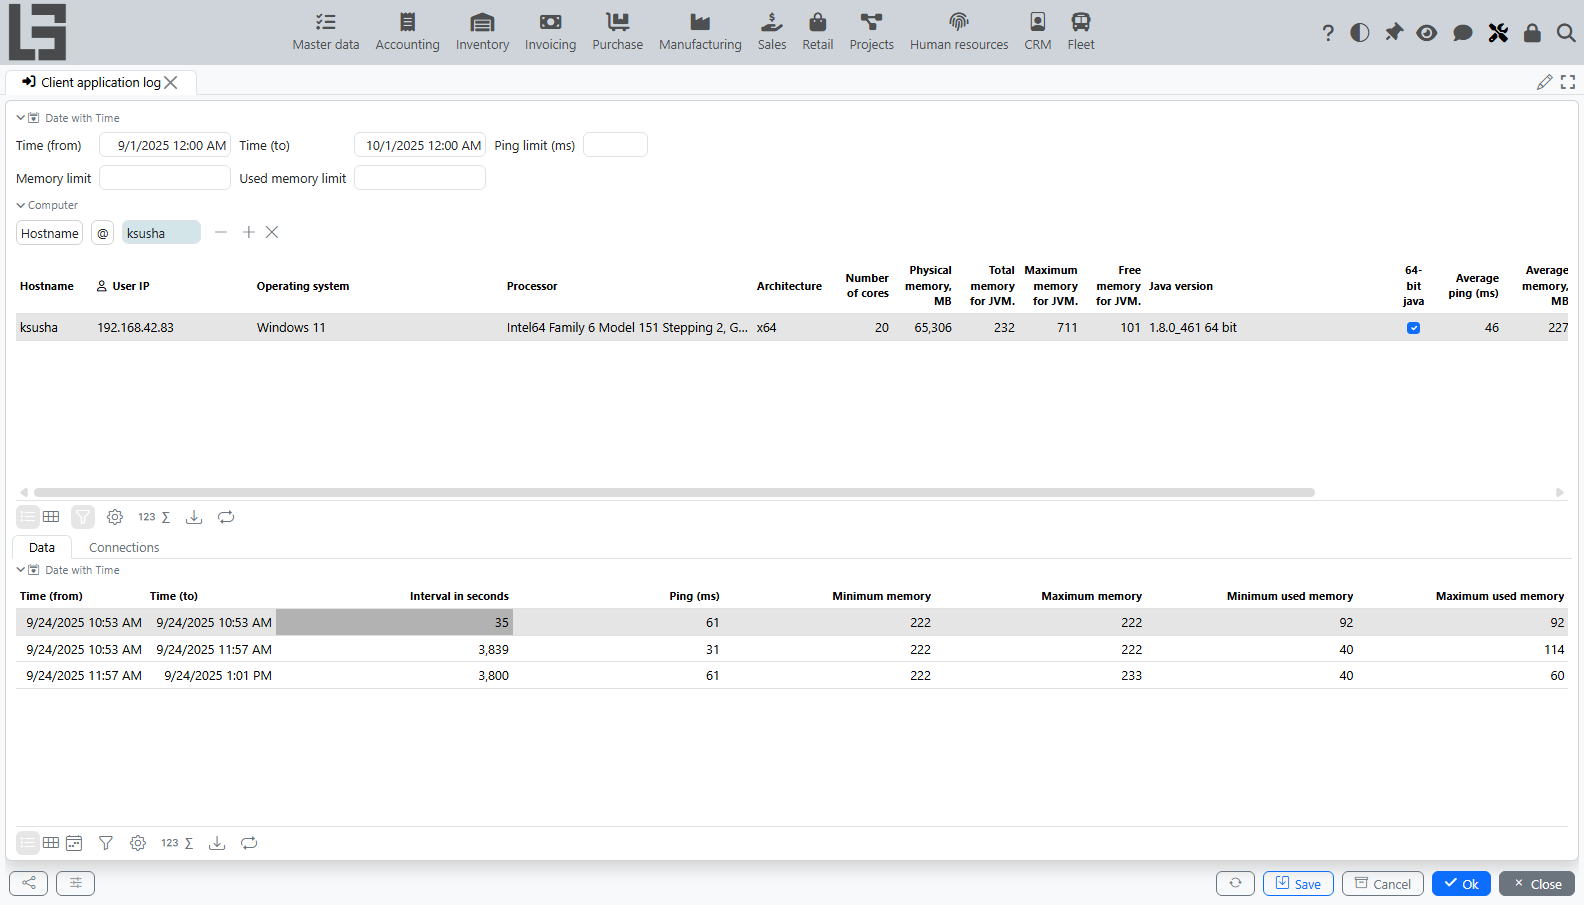
Contains information about the quality of the connection while working with the application server for a given period of time.
As well as system memory indicators, you can analyze the average response time (ping) in milliseconds and the memory available to and used by the java application on client computers in the upper part of the form. The period to be analyzed is set by entering Date from and Date to in the Date and time section. In addition to dates, you can also set a threshold value here for the same indicators (ping and memory) — this allows you to get the total time (in seconds) when the client PC has exceeded the threshold values.
The Data tab at the bottom provides a chronology of changes in response time and in memory available and used. This information is displayed for the Desktop client only.
Log retention
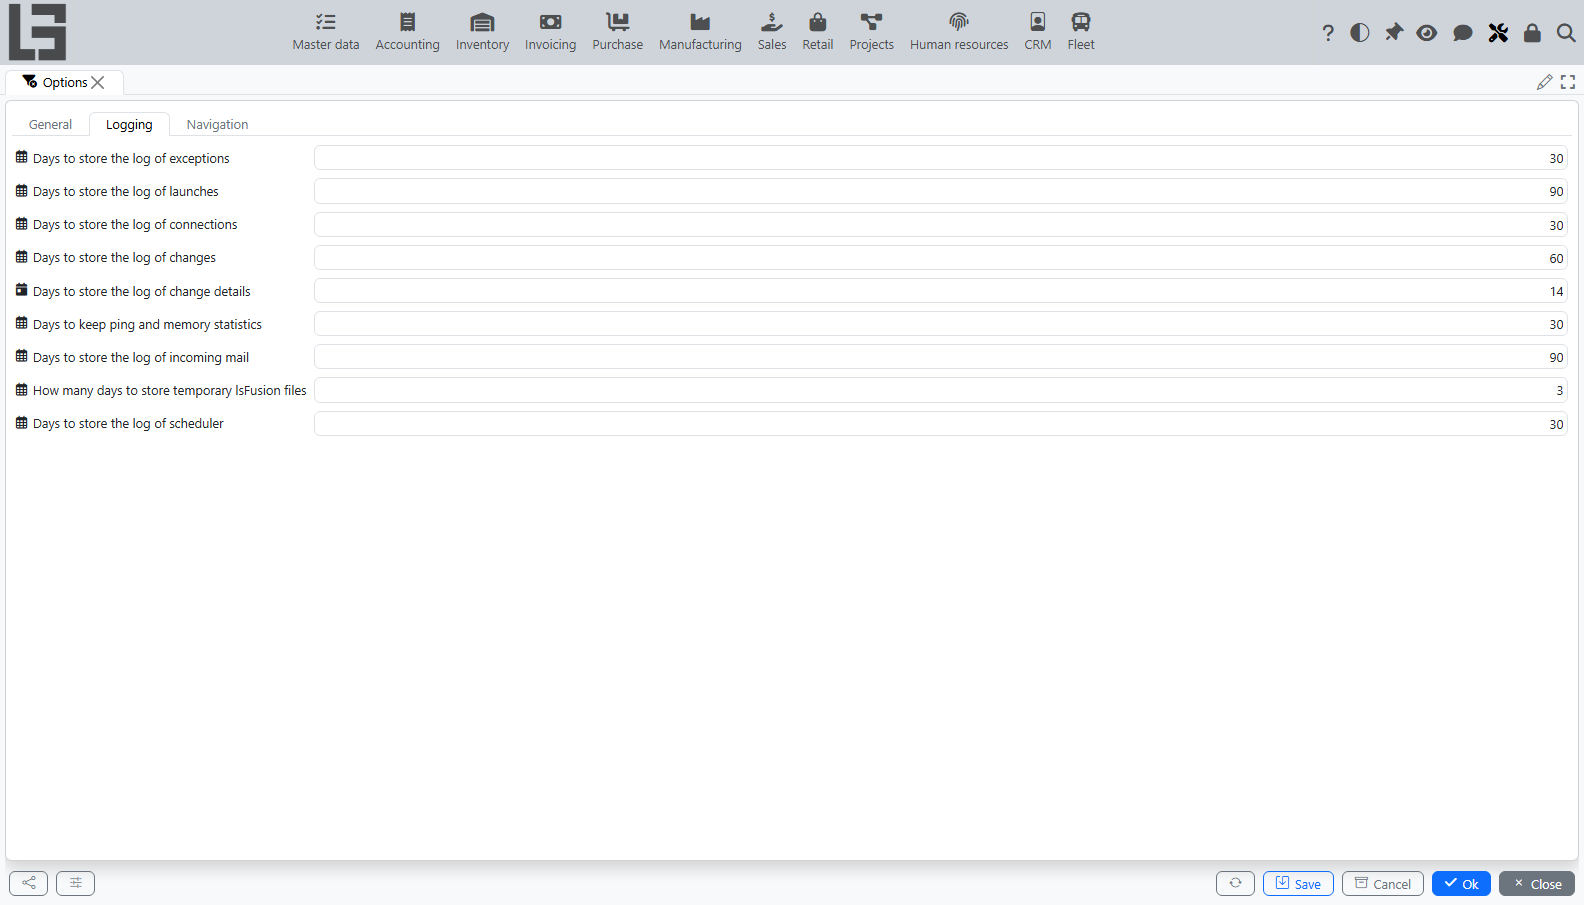
How much information should be stored in these logs is indicated in the Admin form > Settings > Logging tab.
User logging
If you need to track changes to the individual values of any Properties (columns) on specific Forms, a mechanism for user logging has been developed to allow you to do it. For example, let's say you need to record changes to an employee's last name in the Employees directory. To do this:
-
go to any entry in the
Surnamecolumn and right-click to bring up theSetup property policymenu: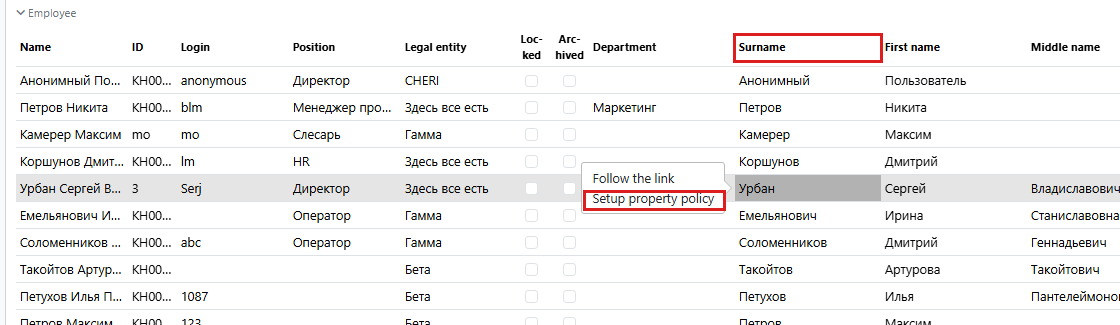
-
in the
Security policyform, checkLogged by userand clickOK: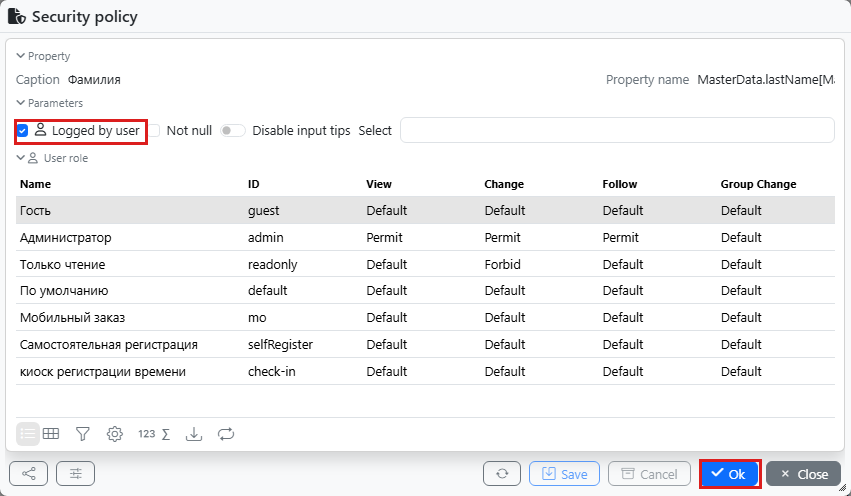
-
once you restart the application server, right-clicking on the
Surnameproperty will bring up an additionalShow Change Historymenu item. If the surname for the current record has been changed by someone, this will be reflected in the property change history: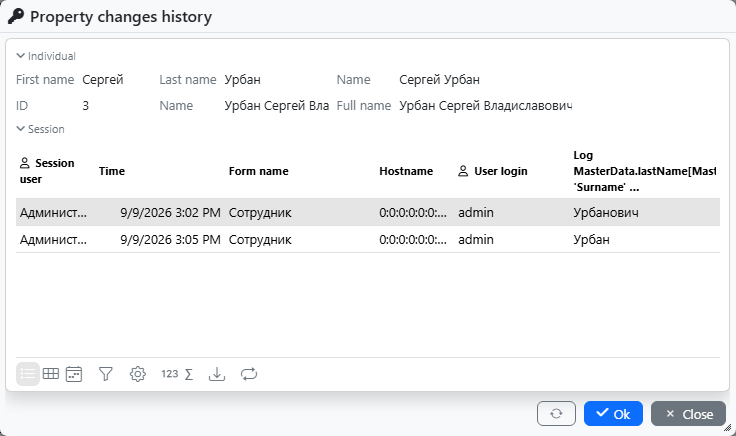
The retention time for these logs is set to the same retention time as for the Change log.
Journal setup mechanism
Each of the journals above is set up in the platform's system modules in a uniform way: a dedicated class is declared for the journal, together with a form for viewing it, a retention-days parameter, and an extension point for clearing stale records. This bundle is generated on the system-module side by the same template, so the retention time is set independently for each journal — on the Administration > Settings > Logging form each journal gets its own row.
Stale records are cleared on schedule through a common clearApplicationLog extension point. An application module can hook into this point to add its own journal to the shared cleanup cycle without setting up a separate scheduler entry.
Logs
The following set of logs is supported for each platform component in the platform:
| Component | Folder | Logs |
|---|---|---|
| Application server (Server) | $FUSION_DIR$/logs, where $FUSION_DIR$ is the application server startup folder |
|
| Web server (Client) | $CATALINA_BASE$/logs, where $CATALINA_BASE$ is the folder where Tomcat is installed |
|
| Desktop client | $USER_DIR$/.fusion/logs, where $USER_DIR$ is the user folder |
|
With automatic installation under Linux, symlinks for these folders (as well as for the lsFusion launch parameters) are automatically created to other folders whose location is better aligned with Linux ideology.
What goes into the logs
Many of the server logs above are filled only while the matching diagnostic mode is on for a particular user - the per-user diagnostic flags on the logging tab of the settings form. The working parameters below decide what each mode then writes, and how much.
| Log | Parameter | Default | What it decides |
|---|---|---|---|
sql | logTimeThreshold | 60 ms | While debug logging is on for a user (loggerDebugEnabled), a statement of that user that finishes and took longer than this is written with the lsFusion call stack and the running totals of logged time and count, which are kept for the whole server process and not for one connection; the faster ones only add to those totals. A statement that ends with an error is not written here at all, however slow it was |
explainexplaincompile | explainNoAnalyzeThreshold | 10000 ms | With EXPLAIN ANALYZE mode on for a user (explainAnalyzeMode), a statement whose estimated cost exceeds this is explained once more before it runs - a plain EXPLAIN (VERBOSE, COSTS) that does not execute it - so that a plan is captured even if the real execution then hangs or is interrupted. That plan is written only if the statement is still running after a delay, or if it fails; when it succeeds in time the plan is dropped and only the usual explainThreshold output remains. 0 explains every statement this way |
explain | explainThreshold | 100 ms | With EXPLAIN ANALYZE mode on for a user (Service.explainAnalyzeMode[User]), the plan of that user's statement is written when the planning plus execution time by that plan reaches the threshold. A read query is rerun under analysis for this, and only if its original execution also reached the threshold, while a data-modifying statement is executed under analysis right away, including when changes are applied. 0 turns the time filtering off. Only SQL statements that are actually executed reach the log, so an assignment to a property does not reach it by itself: the statement that writes the property's table is not executed at the assignment - the change accumulates in the session, and the statement, with its plan, is executed when the changes are applied, where the lsFusion stack of its record points at the apply (the saving of the property's changes), not at the assignment operator. The assignment itself executes - and can write into the log - only the queries needed to compute the changed rows and their values, and the queries to the session temporary table, to which the accumulated changes of the property move from memory as soon as more than one row is changed |
explainapp | explainAppThresholdexplainThresholdexplainAllocatedBytesThreshold | 1000 ms100 ms0 bytes | With the profiler on for a user (explainAppEnabled), every nested call of that user's request is measured - its Java time, its SQL time and, if asked, the memory it allocated - and the calls that stand out are marked in an indented tree. A call is marked when its Java time reaches explainAppThreshold, its SQL time reaches explainThreshold (the same threshold also governs the explain log, see the working parameters), or its allocated memory exceeds explainAllocatedBytesThreshold. The zero allocated bytes threshold turns the memory measurement off entirely rather than marking every call |
explainapp | explainTopAppThresholdexplainTopThresholdexplainTopAllocatedBytesThreshold | 0 ms0 ms0 bytes | Whether that tree is written at all: it is, once the outermost call of the request reaches one of these (the memory one is checked only while the memory measurement is on). At these defaults the outermost call always qualifies, so what actually reaches the log is decided by the per-call values above - a request in which no call was marked writes nothing. Raise them to keep only the heavy requests |
sqlhand | explainTemporaryTablesLogSize | 1000 events | With the temporary-table trace on for a connection (explainTemporaryTablesEnabled), every event in the life of a session table on that connection - it is created, taken from the pool, emptied, dropped, rolled back - is kept in memory, in a ring buffer of this many events per connection. Nothing is written out until that connection later hits a "relation does not exist" error for such a table: the retained history of that table is then written, each event with the stack that caused it |
sqlhand | checkStatementSubstringcheckExcludeStatementSubstring | empty empty | An ad-hoc probe: a statement whose text, as the database driver renders it, contains the first fragment is written before it runs, together with the Java and lsFusion stacks that produced it; a statement that contains the second fragment as well is skipped. Meant to be set for the length of an investigation and cleared afterwards |
sqlconflict | logConflictStack | false | Every update conflict and deadlock is written as a single line; this adds to it the Java and lsFusion stacks of the statement that ran into it, which is what shows which business logic caused the conflict |
jdbc | logLevelJDBC | 0 | Routes the internal tracing of the PostgreSQL driver itself here - a level below the platform's own sql log. Any non-zero value turns it on; it is not a graded level. It is applied at startup and re-checked every time a connection is taken from the pool, so turning it on reaches a running server; turning it back off does not - the driver keeps writing until the server is restarted |
exinfo | outSelectLengthThreshold | 100000 characters | Caps the textual dump of a query result that the platform writes here for debugging: once the rendered rows pass it, the dump stops and ends with and more... |
exinfo | logSqlProcesses | false | Makes every refresh of the process monitor additionally dump here the JVM threads, the platform's own map of database sessions to threads, and every polled database process - meant for debugging how the monitor matches processes to threads, and very chatty while it is on |
httpfromexternalsystemrequestshttptoexternalsystemrequests | logFromExternalSystemRequestslogToExternalSystemRequests | falsefalse | Log every request an external system makes into the platform and every call the platform makes out, respectively. An entry carries the method and the address of the request, at INFO for a successful response and at ERROR otherwise |
httpfromexternalsystemrequestshttptoexternalsystemrequests | logFromExternalSystemRequestsDetaillogToExternalSystemRequestsDetail | falsefalse | Add to those entries the headers, the cookies and the bodies of the request and of the response; on their own, with the parameter above turned off, they do nothing |